- Reflecting the Fed’s campaign of rate hikes throughout 2022, yields have risen sharply in U.S. Treasuries, and investors should consider a higher allocation to the asset class (Figure 1)
- Yields in the short end of over 4% appear compelling, with low price risk and zero credit risk
- According to a survey done by the Philadelphia Federal Reserve, more people expect a recession in 2023 than at any time in the last fifty years11
- In the event of a recession, the Fed could potentially cut rates in the second half of 2023, offering investors potential capital gains on their U.S. Treasury positions as rates fall
- Longer duration U.S. Treasuries could provide outperformance potential in anticipation of the downward policy pivot by the FedFigure 1
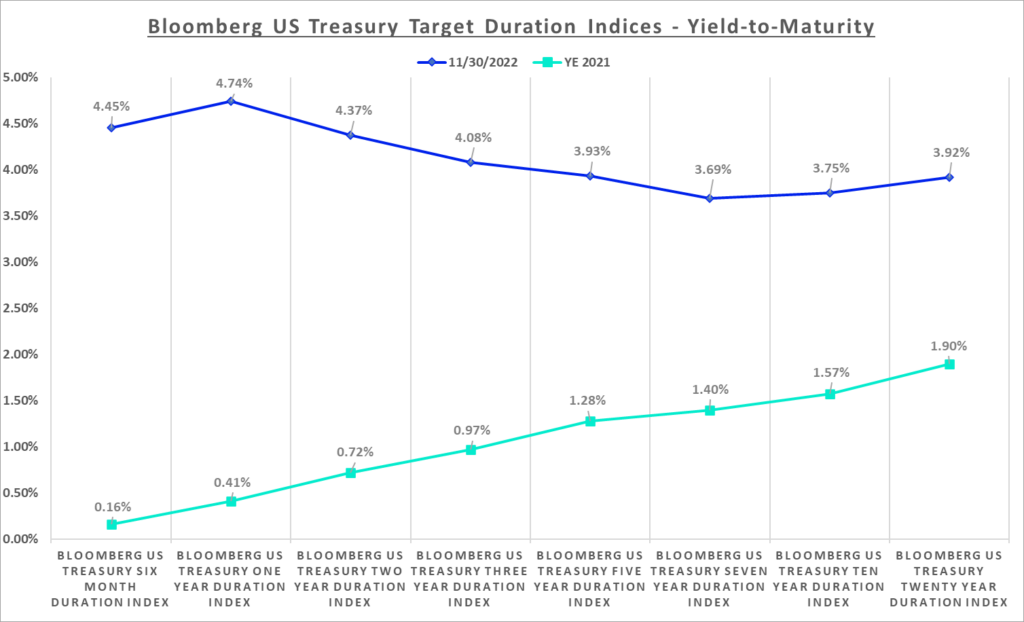 Source: Bloomberg, as of 11/30/2022 Past performance is not indicative of future results. You cannot invest directly in an index. The Bloomberg U.S. Treasury 10-Year Duration Indices are designed to target each respective duration using U.S Treasury securities. The indices are constructed using U.S. Treasury Notes/Bonds in Bloomberg’s US Treasury Index. Duration is the risk associated with the sensitivity of a bond’s price to a one percent change in interest rates. The higher the duration, the more sensitive a bond investment will be to changes in interest rates. Yield to maturity is the discount rate that equates the present value of a bond’s cash flows with its market price (including accrued interest).
- Investors are well-compensated for investment-grade corporate risk at yields of over 5%, levels not seen since the Great Financial Crisis (Figure 2)
- Corporate fundamentals remain solid, with leverage statistics still below pre-pandemic levels, strong debt coverage ratios, and resilient earnings12
- Although there could be softening of investment grade fundamentals in 2023, we are not currently forecasting weakness that would result in a wave of fallen angelsFigure 2
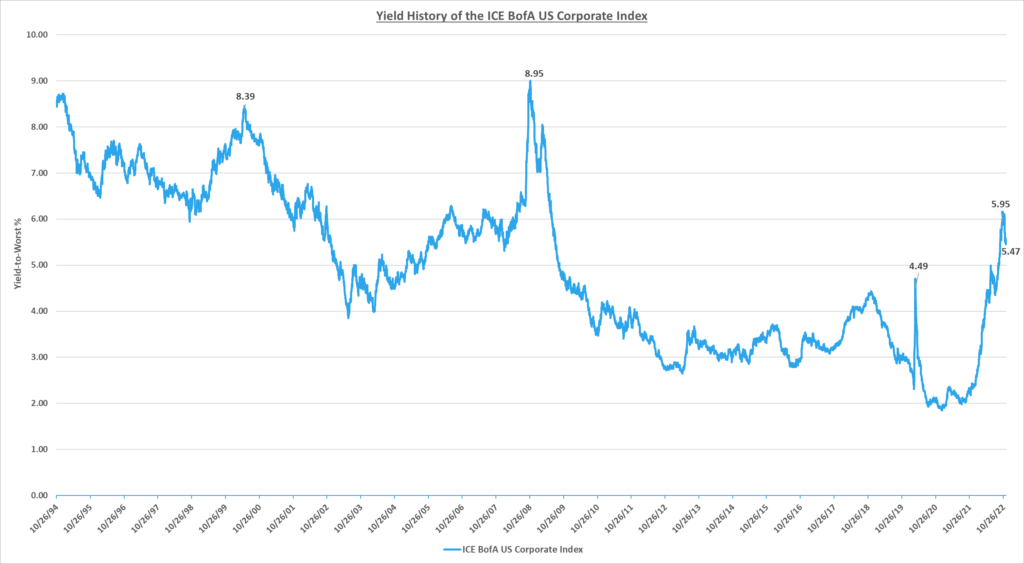 Source: ICE Data Services, as of 11/30/2022 The ICE BofA US Corporate Index tracks the performance of US dollar-denominated investment grade rated corporate debt publicly issued in the US domestic market. Past performance is not indicative of future results. You cannot invest directly in an index.
- Fundamentals could become more challenged for high yield in 2023, especially at the lowest end of the credit quality spectrum
- Despite the potential for spread widening if the U.S. heads into a recession, we believe that the asset class is expected to generate positive total return performance in 2023, reflecting the higher coupon income
- Although corporate defaults could trend higher over the next year, we project that corporate defaults will remain below their long-term average
- Our key investment thesis is that the dispersion of returns across industry sectors and credit rating categories will remain elevated, creating opportunities for outperformance based on sector and credit quality selection; the wide dispersion year-to-date is shown in Figure 3
- Reflecting the potential for a recession, we recommend investors overweight the higher quality segments of the credit rating spectrum, rated BB and single-B, and underweight CCC’s
- At current spread and yield levels, we consider single-B’s the “Goldilocks” of high yield, as these companies are less rate-sensitive than BB’s, have higher credit quality with less idiosyncratic risk than CCC’s, and offer a yield/spread pickup versus both BB’s and the broad high yield index
- Industry sectors we favor include:
- Energy, reflecting the healthy cash flows these predominantly BB-rated companies are generating as well as their continued focus on de-leveraging;
- Core Industrial, reflecting the still-strong balance sheets and resilience in earnings that has been exhibited by many of the underlying companies in this sector
- Industry sectors we recommend underweighting:
- Healthcare: despite the higher yield available in the Healthcare industry sector, we would still recommend that investors underweight this sector, reflecting the potential for continued fundamental deterioration and downgrades
Figure 3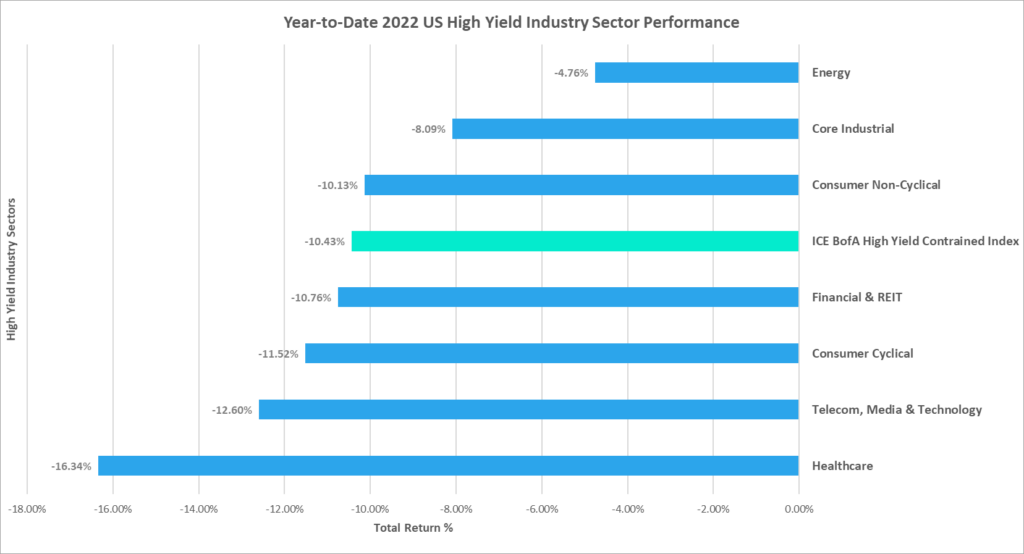 Source: ICE Data Services, as of 11/30/2022
- Although emerging markets (EM) debt was among the worst performing fixed income asset classes in 2022 (Figure 4), the negative total return performance was largely rates-driven due to their long duration profile
- The asset class may be further away from a sustained recovery than other fixed income sectors, as further weakness in global economic conditions could have an amplified adverse effect on EM
- Credit spreads could continue to widen in EM during 2023 reflecting the impact of this continued global economic weakness
- Tighter financial conditions could also continue to negatively impact the asset class, highlighting vulnerabilities for countries that need to refinance their deficits at materially higher borrowing costs
- A shorter duration approach to EM investing continues to be our recommendation to reduce both interest rate and spread duration risk, as a shorter duration approach has outperformed during historical market drawdowns (Figure 4)
Figure 4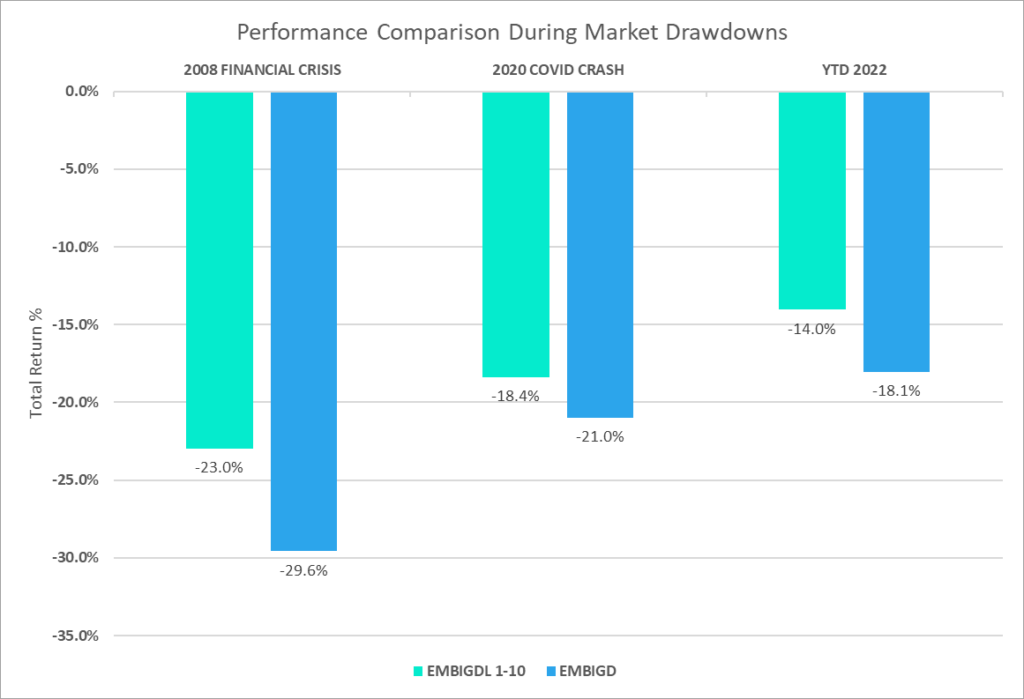 Source: J.P. Morgan, as of 11/30/2022. A market drawdown is a peak-to-trough decline during a specific investment period. The blue represents the JP Morgan EMBI Global Diversified Index (EMBIGD), which tracks total returns for traded external debt instruments in the emerging markets, including US dollar-denominated Brady bonds, loans, and Eurobonds with an outstanding face value of at least $500 million. The green represents the J.P. Morgan 1-10 Year Emerging Markets Sovereign Index (EMBIGDL 1-10), which tracks liquid, US dollar emerging market fixed and floating-rate debt instruments issued by sovereign and quasi sovereign entities. The EMBIGDL 1-10 Index is based on the long-established J.P. Morgan EMBI Global Diversified Index and follows it methodology closely, but only includes securities with at least $1 billion in face amount outstanding and average life below 10 years.
- 1 Source: Bloomberg
- 2 Source: Bloomberg
- 3 Source: Bloomberg
- 4 Source: Bloomberg, Bureau of Labor Statistics
- 5 Source: Bloomberg
- 6 Source: Federalreserve.gov/cbdc-public-comments.htm
- 7 Source: Bureau of Labor Statistics, as of 12/01/2022
- 8 Source: Dallas Fed Global Perspectives Conference, 11/28/2022
- 9 Source: Bloomberg
- 10 Source: ICE Data Services, Bloomberg
- 11 Source: Federal Reserve Bank of Philadelphia, as of 11/14/22
- 12 Source: J.P. Morgan
- 13 Source: J.P. Morgan
- 14 Source: J.P. Morgan
This commentary is provided for informational purposes only and is not an endorsement of any security, sector, or index. The views expressed herein are subject to change and do not constitute investment advice or a recommendation regarding any specific product or security. Past performance is no guarantee of future results. Investing involves risk including possible loss of principal.
Investments in fixed income securities are subject to risks including but not limited to interest rate risk, credit risk and market risk, each of which could have a negative impact on the value of the holding. Credit risk refers to the possibility that the issuer or other obligor of a security will not be able or willing to make payments of interest and principal when due. There is an inverse relationship between interest rate movements and bond prices. Generally, when interest rates rise, bond prices fall and when interest rates fall, bond prices rise. To the extent that interest rates rise, certain underlying obligations may be paid off substantially slower than originally anticipated and the value of those securities may fall sharply.
Carefully consider the Funds’ investment objectives, risks, charges, and expenses before investing. This and other information can be found in the Funds’ prospectus or, if available, the summary prospectus, which may be obtained by visiting (insert link). Read the prospectus carefully before investing.
Distributor: Foreside Fund Services, LLC.