BondBloxx Midyear 2024 Fixed Income Market Outlook
Ride the yield wave, but don't paddle too far out the curve just yet
July 15, 2024
This piece provides a recap of fixed income markets in the first half of 2024, our views on what’s ahead, and investment ideas to help investors position their portfolios amid Federal Reserve (Fed) policy and election season uncertainty.
Our top fixed income investment ideas
| Goal | ETF it | |
|---|---|---|
| Give yourself more credit | Our top pick: capture the highest yield in fixed income from diversified CCC rated high yield bonds | XCCC |
| Access yields near 13-year highs from the persistent investment grade outperformer,1 BBB rated corporate bonds | BBBS | |
| Ride the yield wave | Generate income and manage liquidity with short-term U.S. Treasuries | XHLF |
| Position for Fed policy actions with intermediate-term U.S. Treasuries | XTWO | |
| Look beyond munis | Seek to maximize after-tax total return with an active tax-aware strategy | TAXX |
| Find value off the beaten path | Diversify internationally with compelling yields from short-duration emerging market bonds | XEMD |
First Half 2024 Recap
In the first half of 2024, the U.S. economy moderated from the robust growth of late 2023 but remained more resilient than other developed economies. While Gross Domestic Product (GDP) growth slowed, key indicators like consumer spending, employment levels, and business investment remained solid. However, hotter-than-expected inflationary pressures persisted, driven by factors such as strong consumer spending, rising housing costs, elevated energy prices, and supply chain disruptions. In our view, the Federal Reserve (Fed) acted appropriately by maintaining the federal funds rate at 5.50% and scaling back their 2024 rate cut projections.
Yields across fixed income asset classes rose as investors recalibrated their expectations for fewer rate cuts and later timing. The U.S. high yield market extended its two-year trend of outperformance, leading fixed income asset classes year to date, driven by higher coupon income, supportive fundamentals, and lower interest rate sensitivity (Figure 1). Persistent inflation and rising yields negatively impacted long-duration exposures, with long-term U.S. Treasuries, investment-grade corporates, and the U.S. Aggregate index experiencing depressed total returns.
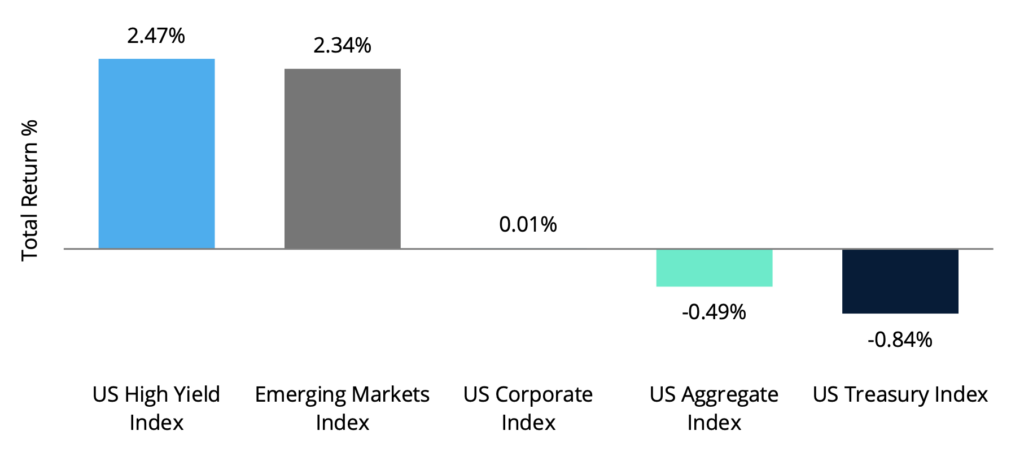
Source: ICE Data Services as of 6/30/2024. The indices represented in this chart include the ICE BofA U.S. High Yield Index, the J.P. Morgan EMBI Global Diversified Index, the ICE BofA U.S. Corporate Index, the ICE BofA Broad Market Index, and the ICE BofA U.S. Treasury Index. An investment cannot be made in an index. Past performance does not guarantee future results.
Our Outlook
Economic resilience = fixed income opportunities
We expect the U.S. economy to remain resilient in the current high interest rate environment.
Regarding interest rate policy, we do not view the current rate levels as overly restrictive. The Fed is likely to keep rates elevated until inflation shows sustained moderation below the current low 3% range, and we agree that maintaining higher rates for longer is necessary to tackle stubborn inflation.
Our optimistic view on select areas of the fixed income market is supported by several resilient economic indicators:
- The U.S. unemployment rate remains stable near 4.0%, with the jobs market strong despite some softening.
- While inflation-adjusted retail sales statistics have started to weaken, consumers spending continues, supporting GDP growth (Figure 2).
- Corporate balance sheets across investment grade and high yield are generally well-positioned to weather potential economic slowdowns.
- We expect U.S. high yield defaults will stay at or below the long-term average of 4% for the remainder of the year. The BB-rated bias of near-term debt maturities and strong fundamentals should prevent a severe default cycle.
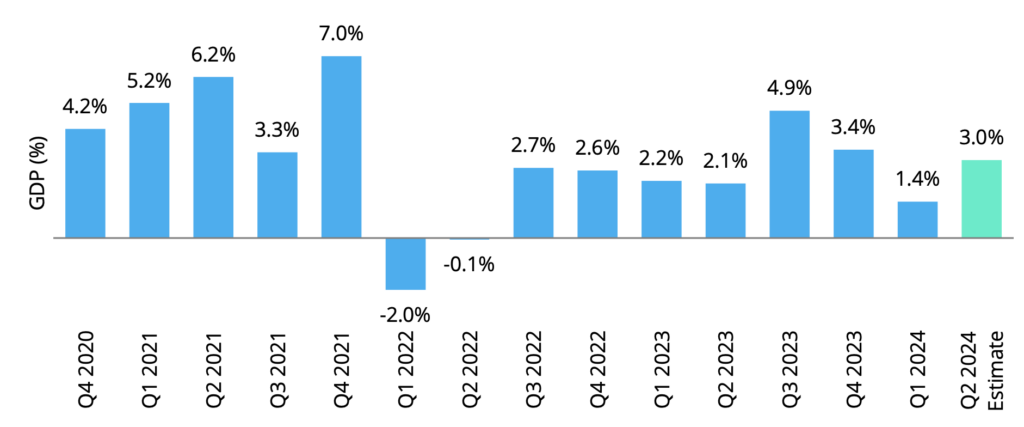
Source: Bloomberg Data Services, as of 6/30/2024. Source for the Q2 2024 GDP estimate is the Atlanta Federal Reserve.
Outlook by Asset Class
U.S. High Yield Corporates
Give yourself more credit with CCC rated high yield bonds, still our top pick
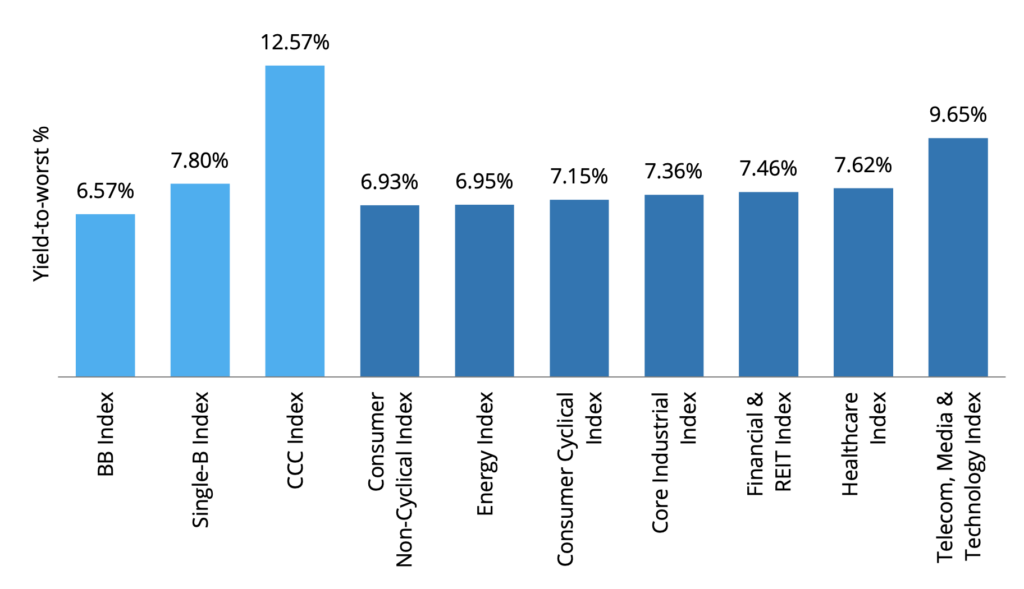
- Our view: Consistent with our view since the last quarter in 2022, we expect U.S. high yield bonds to continue to outperform within fixed income, with compelling yields and strong fundamentals (Figure 4).
- Corporate fundamentals: Stronger fundamentals for U.S. high yield remain a clear differentiator this cycle, with average credit quality still near all-time highs. High yield corporate balance sheets remain well-positioned. Issuers continue to actively address their debt maturities, reducing the chance for a significant rise in corporate defaults.
- Performance: U.S. high yield performance was led by BBs (+2.5%) and single-Bs (+2.5%) during the first half of 2024, as the elevated coupon income generated by these credit rating categories more than offset modest price declines experienced during the time period. Among high yield industry sectors, Healthcare and Energy were outperformers, returning 5.0% and 4.4% respectively.
- Investment ideas: We suggest that investors consider the BondBloxx XCCC ETF to capture the highest yield available in U.S. fixed income markets and attractive total return potential. Figure 3 provides more ideas for using specific credit rating high yield bond ETFs to align with your goals.
| Goal | ETF Name | Ticker |
|---|---|---|
| Elevated yields with the most balance sheet strength. | BondBloxx BB-Rated USD High Yield Corporate Bond ETF | XBB |
| Attractive coupon income with yield pick-up over BB’s. | BondBloxx B-Rated USD High Yield Corporate Bond ETF | XB |
| Access the highest yield available in U.S. fixed income markets while reducing the risk of individual CCC-rated corporate bonds. | BondBloxx CCC-Rated USD High Yield Corporate Bond ETF | XCCC |
Investment Grade Corporates
Give yourself more credit with BBBs, the persistent investment grade outperformer
- Our view: BBB corporates are our number one pick in the U.S. investment grade universe, reflecting their excellent corporate fundamentals and yields still near-13-year highs.
- Corporate fundamentals: BBB corporate fundamentals remain strong, supported by healthy earnings, ample interest coverage ratios exceeding 7x, and manageable debt levels. BBB corporate balance sheets are extremely well-positioned to manage a potential economic slowdown over the coming year.
- Performance: The persistent long-term outperformance track record generated by BBB corporate bonds has been driven by the category’s historically higher average coupon income (Figure 6) compared to broad U.S. corporate indices. Year-to-date 2024, the shorter duration BBB 1-5 year maturity range has outperformed other investment grade categories.
- Investment ideas: Short BBB exposure with the BondBloxx BBBS ETF may help investors capture attractive yield and total return potential, with less performance volatility than longer duration investment grade bonds. Figure 5 provides more ideas on using BBB corporate bond ETFs to align with your goals.
| Goal | ETF Name | Ticker |
|---|---|---|
| Seek current higher yields with relatively low risk in short-term corporate bonds when expecting stable rates. | BondBloxx BBB Rated 1-5 Year Corporate Bond ETF | BBBS |
| Mitigate reinvestment risk and capture potential yield advantages while maintaining similar duration compared to US Aggregate index funds in anticipation of interest rate cuts. | BondBloxx BBB Rated 5-10 Year Corporate Bond ETF | BBBI |
| Capitalize on the potential for falling interest rates and long-term returns. | BondBloxx BBB Rated 10+ Year Corporate Bond ETF | BBBL |
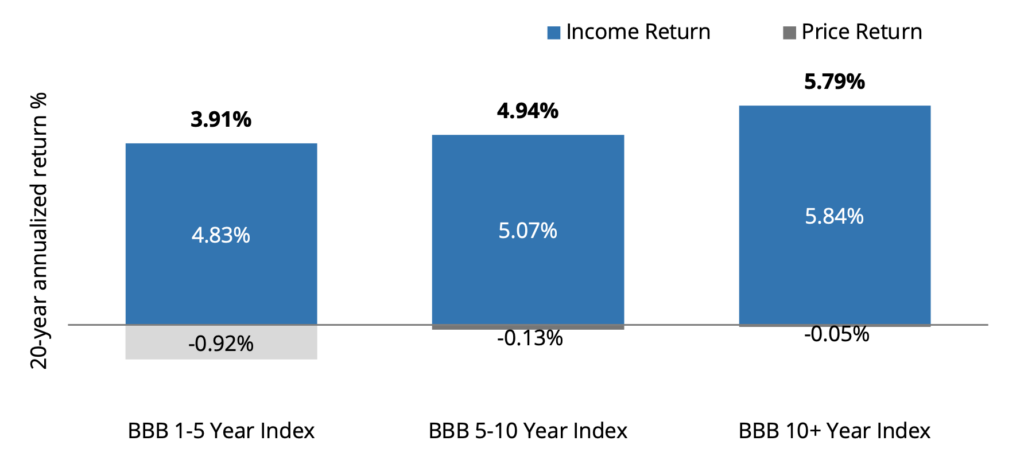 Source: ICE Data Services, as of 6/30/2024. The indices represented in this chart include the ICE BofA BBB 1-5 Year US Corporate Index, the ICE BofA BBB 5-10 Year US Corporate Index, and the ICE BofA BBB 10+ Year US Corporate Index. Past performance is not indicative of future results. It is not possible to invest in an index.
U.S. Treasuries
Ride the yield wave, stick to short-to-intermediate
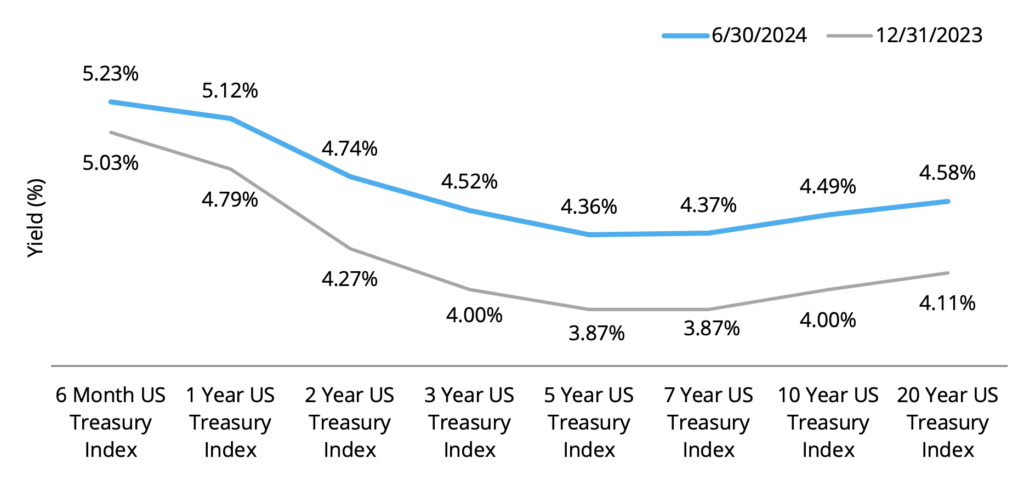
- Our view: Capture the yields of short-to-intermediate U.S. Treasuries and avoid the choppy waters of the long-end of the curve due to Fed policy uncertainty (Figure 8).
- Performance: The shorter end of the U.S. Treasury curve experienced the best performance in the first half of 2024, with still elevated yields and low volatility. The long end of the U.S. Treasury curve experienced negative performance in the first half, as long-dated U.S. Treasuries sold off since year-end 2023 due to higher-than-expected inflation.
- Investment ideas: The BondBloxx XHLF ETF offers attractive yields and can be used to manage liquidity. With probable Fed action later this year or early in 2025, we recommend that investors step out on the curve a bit with our XTWO ETF to capture potential price appreciation. Figure 7 provides more ideas on using target duration U.S. Treasury ETFs to align with your goals.
| Goal | ETF Name | Ticker |
|---|---|---|
| Short-term strategy to generate higher income and manage liquidity |
|
|
| Navigate Fed rate cuts by going slightly longer on the duration curve. |
|
|
| Further extend out on the yield curve to manage large or multiple Fed rate cuts by 2024. |
|
Tax Aware Strategies
Tax-Aware Means More Than Buying Municipal Bonds
- Our view: There is more to tax-aware investing than just municipal bonds, and it is important to look at all fixed income opportunities through a tax lens to maximize after-tax total return performance.
- Performance: Historically, there have been wide variations in after-tax returns across fixed income categories (Figure 9). During the first half of 2024, short duration corporate and securitized bonds enhanced performance of multi-asset class tax-aware fixed income strategies. Recent widening of municipal bond spreads have improved the current valuations for this asset class.
- Investment ideas: With its compelling tax-equivalent yield, the actively managed TAXX ETF can be used as a replacement for an investor’s short-duration fixed income portfolios and a more tax-efficient allocation than cash.
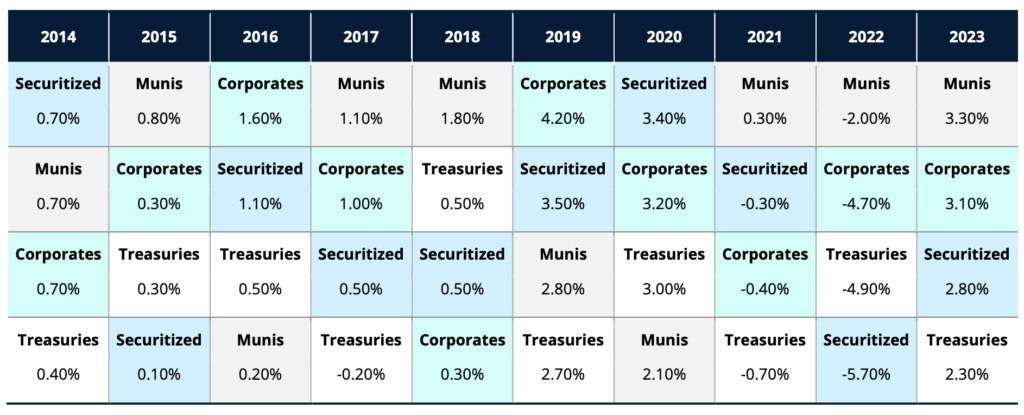
Source: Bloomberg and IR&M Analytics as of 12/31/2023. Past performance is not indicative of future results. It is not possible to invest in an index.
Emerging Market Sovereign Debt
Find value off the beaten path with short duration emerging markets
- Our view: We think investors should consider increasing their exposure to emerging markets sovereign bonds, which are attractive due to resilient global economic conditions, moderating inflation, and a weakening U.S. dollar.
- Performance: Shorter duration emerging markets sovereign bonds (1-10 year maturities) experienced the best performance in fixed income in the first half of 2024, benefiting from spread tightening and its lower sensitivity to interest rate risk (Figure 10).
- Investment ideas: A shorter duration approach to investing in emerging markets bonds offered by BondBloxx’s XEMD ETF offers the opportunity to invest in a diversified portfolio of emerging markets issuers, benefit from attractive yields, and reduce both interest rate and spread duration risk in the asset class.
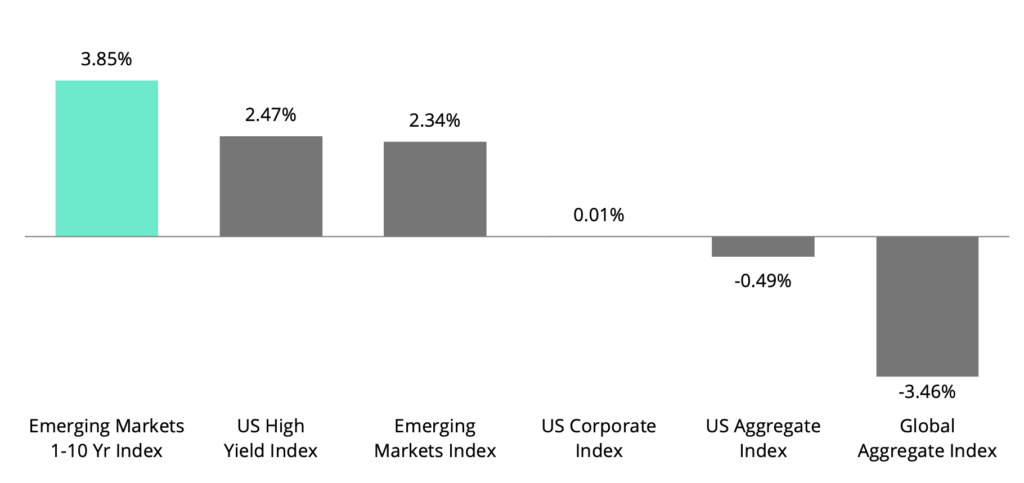 Source: J.P. Morgan, ICE Data Services, as of 6/30/2024. The indices represented in this chart include the ICE BofA U.S. High Yield Index, J.P. Morgan 1-10 Year Emerging Markets Sovereign Index, the Bloomberg U.S. Aggregate Index, the J.P. Morgan EMBI Global Diversified Index, the ICE BofA U.S. Corporate Index, and the Bloomberg Global-Aggregate Total Return Index. Past performance is not indicative of future results. It is not possible to invest in an index.
Key takeaways
Let Fixed Income Do More for You
We believe opportunities exist across the fixed income landscape, with yields in most sectors at decade highs and an economic environment that remains resilient. The potential for increased performance dispersion within asset classes means that investors will be well-served looking beyond broad-based benchmarks to invest with precision in the ratings, sectors, and duration categories that benefit from the current economic cycle and Fed policy.
Glossary and Index Definitions
- Basis Point is a standardized measure to denote a percentage change in interest rates, spreads, or other financial metrics. 1 basis point is equivalent to one-hundredth of a percentage point (0.01%).
- Below investment grade bonds: Bonds that are deemed speculative. According to the S&P Global Ratings, these bonds are rated ‘BB’, ‘B’, ‘CCC’, ‘CC’, and ‘C’ where ‘BB’ indicates the least degree of speculation and ‘C’ the highest.
- The Bloomberg Asset Backed Securities 1-3 Year Statistics Index is a broad-based flagship benchmark that measures the investment grade, U.S. dollar-denominated, fixed-rate taxable bond market of maturities between 1-3 years.
- The Bloomberg Commercial Mortgage-Backed Securities Investment Grade 1-3.5 Year Statistics Index measures the investment grade market of US Agency and US Non-Agency conduit and fusion CMBS deals with a minimum current deal size of $300mn and securities with an average life of 1 to 3.4999 years. The index includes both US Aggregate eligible and non-US Aggregate eligible securities.
- The Bloomberg Global-Aggregate Total Return Index is a flagship measure of global investment grade debt from twenty-eight local currency markets. This multi-currency benchmark includes treasury, government-related, corporate and securitized fixed-rate bonds from both developed and emerging markets issuers.
- The Bloomberg Municipal 1-3 Year Index measures the performance of USD-denominated tax-exempt bond market with maturities of 1-3 years, including state and local general obligation bonds, revenue bonds, insured bonds, and pre-refunded bonds.
- The Consumer Bloomberg U.S. 10-Year Real Yield Index is an index of 10-year U.S. Treasury inflation-linked securities.
- The Bloomberg U.S. Aggregate Index is broad-based flagship benchmark that measures the investment grade, U.S. dollar-denominated, fixed rate taxable bond market. The index includes Treasuries, government-related and corporate securities, MBS (agency fixed rate pass-throughs), ABS and CMBS (agency and non-agency).
- The Bloomberg U.S. Corporate 1-3 Year Statistic Index measures the performance of investment grade securities which are selected by a market value process with maturity of 1-3 years. The index includes publicly issued USD-denominated corporate issues that have a remaining maturity of greater than or equal to 1 year and less than 3 years, are rated investment grade (must be Baa3/BBB-or higher using the middle rating of Moody’s Investor Service, Inc., Standard & Poor’s, and Fitch Rating), and have $250 million or more of outstanding face value.
- The Bloomberg U.S. Treasury 1-3 Year Index measures US dollar-denominated, fixed-rate, nominal debt issued by the US Treasury with 1-2.999 years to maturity. U.S. Treasury bills are excluded by the maturity constraint, but are part of a separate Short Treasury Index. STRIPS are excluded from the index because their inclusion would result in double-counting.
- The Bloomberg U.S. Treasury Target Duration Indices are a suite of 8 indices designed to target a specific duration using US Treasury securities. The 8 durations targeted are 6 Month, 1 Year, 2 Year, 3 Year, 5 Year, 7 Year, 10 Year and 20 Year.
- Duration is the risk associated with the sensitivity of a bond’s price to a one percent change in interest rates. The higher the duration, the more sensitive a bond investment will be to changes in interest rates. Duration management is important for optimizing investment returns, managing risk, and ensuring that a portfolio aligns with an investor’s financial objectives and risk tolerance.
- The Federal Funds Rate is the interest rate that U.S. banks charge one another to borrow or lend money overnight.
- The ICE BofA Broad Market Index measures the performance of U.S. dollar-denominated, investment grade debt securities, including U.S. Treasury notes and bonds, quasi-government securities, corporate securities, residential and commercial mortgage-backed securities and asset-backed securities.
- The ICE BofA U.S. Corporate Index tracks the performance of U.S. dollar-denominated investment grade rated corporate debt publicly issued in the U.S. domestic market.
- The ICE BofA U.S. High Yield Index tracks the performance of U.S. dollar-denominated, below investment grade-rated corporate debt publicly issued in the U.S. domestic market.
- The ICE BofA U.S. Treasury Index tracks the performance of U.S. dollar denominated sovereign debt publicly issued by the U.S. government in its domestic market.
- The ICE Diversified U.S. Cash Pay High Yield Rating Category Indices contain all securities in the ICE BofA U.S. Cash Pay High Yield Index, broken down by their rating categories: BB1-BB3, B1-B3, and CCC1-CCC3. Index constituents are capitalization-weighted, based on their current amount outstanding.
- The ICE Diversified U.S. Cash Pay High Yield Sector Category Indices contain all securities in the ICE BofA U.S. Cash Pay High Yield Index, broken down by industry including: Industrials; Telecom, Media & Technology; Healthcare; Financial & REIT; Energy; Consumer Cyclicals; Consumer Non-Cyclicals. Index constituents are capitalization-weighted, based on their current amount outstanding.
- Investment grade bonds: Bonds that are deemed to have a lower risk of default. According to the S&P Global Ratings, these bonds are rated ‘AAA’, ‘AA’, ‘A’, and ‘BBB’, where ‘AAA’ indicates the highest capacity for the bond issuer to meet its financial obligation.
- The J.P. Morgan 1-10 Year Emerging Markets Sovereign Index tracks liquid, U.S. dollar emerging market fixed and floating-rate debt instruments issued by sovereign and quasi sovereign entities. The EMBIGDL 1-10 Index is based on the long-established J.P. Morgan EMBI Global Diversified Index and follows it methodology closely, but only includes securities with at least $1 billion in face amount outstanding and average life below 10 years.
- The J.P. Morgan EMBI Global Diversified Index tracks total returns for traded external debt instruments in the emerging markets, including U.S. dollar-denominated Brady bonds, loans, and Eurobonds with an outstanding face value of at least $500 million.
- Market volatility represents variance in returns for a given security of market.
- Spread Duration is the sensitivity of a bond or portfolio’s market price to a change in its option-adjusted spread (OAS).
- The yield curve is a line chart that plots interest rates of bonds that have equal credit quality but differing maturity dates.
- Yield to maturity (YTM) is the overall interest rate earned by an investor who buys a bond at the market price and holds it until maturity.
- Yield to Worst (YTW) is a measure of the lowest possible yield that can be received on a bond that fully operates within the terms of its contract without defaulting.
Disclosures
Carefully consider the Funds’ investment objectives, risks, charges, and expenses before investing. This and other information can be found in the Funds’ prospectus or, if available, the summary prospectus, which may be obtained by visiting BondBloxxETF.com. Read the prospectus carefully before investing.
This commentary is provided for informational purposes only and is not an endorsement of any security, sector, or index. The views expressed herein are subject to change and do not constitute investment advice or a recommendation regarding any specific product or security. Past performance is no guarantee of future results. Investing involves risk including possible loss of principal.
Investments in fixed income securities are subject to risks including but not limited to interest rate risk, credit risk and market risk, each of which could have a negative impact on the value of the holding. Credit risk refers to the possibility that the issuer or other obligor of a security will not be able or willing to make payments of interest and principal when due. There is an inverse relationship between interest rate movements and bond prices. Generally, when interest rates rise, bond prices fall and when interest rates fall, bond prices rise. To the extent that interest rates rise, certain underlying obligations may be paid off substantially slower than originally anticipated and the value of those securities may fall sharply.
Certain information contained herein constitutes “forward-looking statements,” which can be identified by the use of forward-looking terminology such as “may,” “will,” “should,” “expect,” “anticipate,” “project,” “estimate,” “intend,” “continue,” or “believe,” or the negatives thereof or other variations thereon or comparable terminology. Due to various risks and uncertainties, actual events, results or actual performance may differ materially from those reflected or contemplated in such forward-looking statements. Nothing contained herein may be relied upon as a guarantee, promise, assurance or a representation as to the future.
U.S. Treasury obligations may differ from other securities in their interest rates, maturities, times of issuance and other characteristics and may provide relatively lower returns than those of other securities. Similar to other issuers, changes to the financial condition or credit rating of the U.S. government may cause the value of the Fund’s U.S. Treasury obligations to decline. While U.S. Treasury obligations are backed by the “full faith and credit” of the U.S. Government, such securities are nonetheless subject to credit risk.
Securities that are rated below investment-grade (sometimes referred to as “junk bonds,” which may include those bonds rated below “BBB-” by S&P Global Ratings and Fitch or below “Baa3” by Moody’s), or similar securities that are unrated, may be deemed speculative, may involve greater levels of risk than higher-rated securities of similar maturity and may be more likely to default.
Investing in emerging markets involves risks relating to political, economic, or regulatory conditions not associated with investments in U.S. securities and instruments or investments in more developed international markets; Loss due to foreign currency fluctuations, or geographic events that adversely impact issuers of foreign securities.
Certain information contained herein has been obtained from third party sources and such information has not been independently verified by BondBloxx. No representation, warranty, or undertaking, expressed or implied, is given to the accuracy or completeness of such information by BondBloxx or any other person. While such sources are believed to be reliable, BondBloxx does not assume any responsibility for the accuracy or completeness of such information. BondBloxx does not undertake any obligation to update the information contained herein as of any future date.
Distributor: Foreside Fund Services, LLC.